Important note on my add-ons
I’ve (reluctantly) decided to stop supporting all my Apps Script add-ons, as I no longer had the time or inclination to put them through the various verification processes and upcoming add-on store process changes.
I realize that many of you may be using some of them. In order to provide some continuity, since they are open source, you are welcome to make your own copy and use them how you wish. Any developers who want to repackage and republish are also welcome to do so.
Here is the repository. You’ll also find the link to the scripts if you prefer to take a copy of already built scripts.
ChordSnip
Documentation here
Color Arranger
Documentation here
SankeySnip
Documentation here
Slides merge
Documentation here
Dicers
Documentation here

Sankey snip is an add-on for Google Sheets that creates a Sankey flow diagram as you type, gives you the SVG code to embed it in a web site and the ability to embed it in your Sheet. It’s available on the Sheets add-on store.
I’ll use the Google Charts Sankey variant (which is actually also based on D3 under the hood).
Introductory video
Here’s a video showing the features of Sankey Snip
On starting
Here’s the Add-on launching menu item

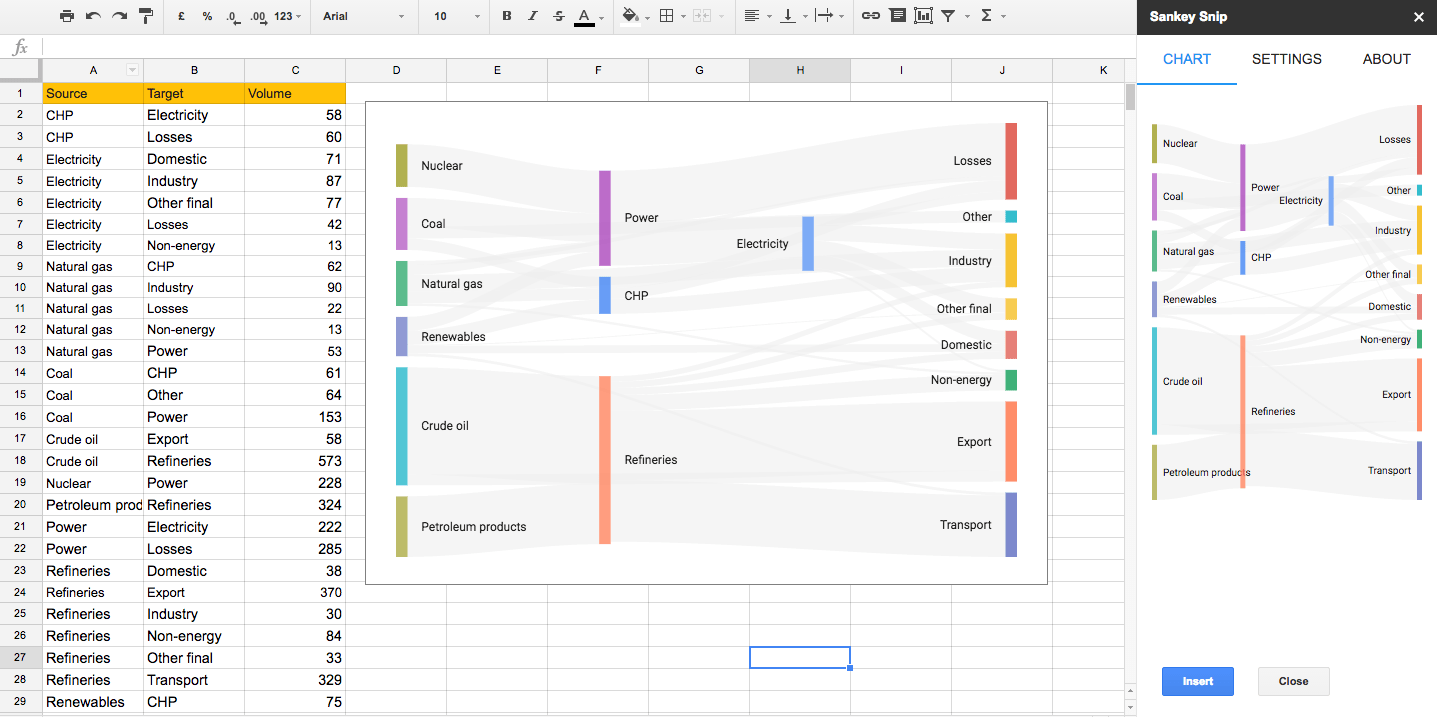
On initialization, Sankey Snip automatically identifies the data on the active sheet and builds a Sankey diagram. The sidebar looks like this and shows a preview of the chart you can choose to insert into your sheet.

About Sankey diagrams
Actually you’ll see the explanation below in the About tab
But here’s a quick explanation for those unfamiliar with Sankey charts.
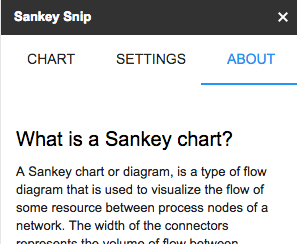
What is a Sankey chart?
A type of flow diagram that is used to visualize the flow of some resource between process nodes of a network. The width of the connectors represents the volume of flow between processes, and typically the overall volume of the resource is preserved throughout the system being visualized. Flows are unidirectional, and loops in the system (A sending to B and then B sending something back to A) are invalid. You can read more about Sankey diagrams here
Sankey Snip is a Google Sheets add-on which maintains a Sankey chart preview in the sidebar of the active sheet’s data in real-time.
Suitable types of data
Sankey charts are often used to show transformations in a system (for example energy sources and uses), or material or money flows between a co-operating group. Google Analytics uses this kind of diagram to report on-site navigation behavior.
Data format
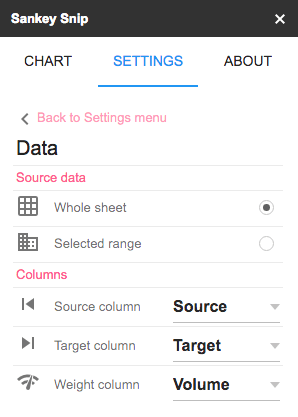
A Sankey chart needs 3 data items, which should be laid out as columns with headers in a sheet.
- Source. Sending process name
- Target. Receiving process name
- Volume. Resource volume that flows between between ‘Source’ and ‘Target’
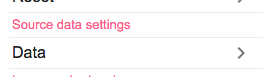
By default, the source data will be automatically detected in the active sheet, but you can customize the column names and range via the Data Settings. Any changes you make to the data will automatically be reflected in the chart preview.
Chart image
You can get a scaled-up version of the chart preview by copying the code shown in the chart settings/embed code area. This will be in SVG format so that you can embed the code or link to the drive file in a web site or document.
It is also possible to insert a static version of the chart in your sheet. The scale and look of the chart is controlled by options in Chart settings.
Google Charts are used for visualization. Information about settings and options can be found here.
Tracking data changes
There is no need for any action to incorporate data changes in the chart preview since Sankey snip automatically detects active data and updates the preview in real-time. It also detects if you switch to another sheet and will attempt to create a chart from whichever sheet is currently active.
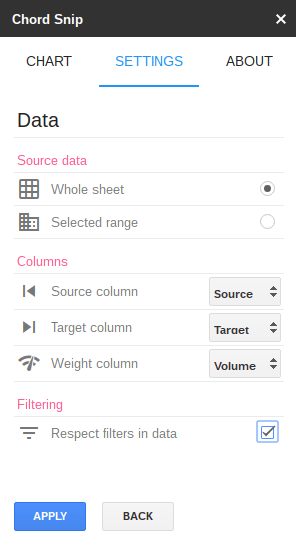
Source data columns
There are 3 columns of interest for a Sankey diagram. Sankey snip will try to deduce which columns are which, but you can explicitly set them via the Data settings dialog. The columns section can be used to modify the source data location.
Source data scope
By default, all the data in the active sheet is incorporated into the chart. If you select an area of data, and choose a selected range from the source data section, the chart will only use data from the selected area.
Inserting a full-sized chart in the sheet.
To embed a chart image in your sheet, select a cell that at which the top left corner of the chart should be positioned, and use Insert.
This will embed a full-sized image as below.
Removing an inserted image
You can manipulate or remove an already inserted image from your sheet with this standard sheets image dialog.
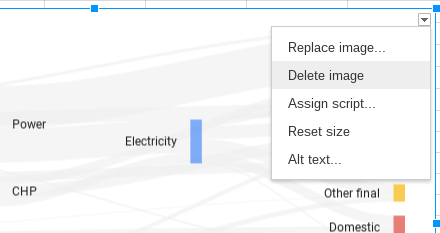
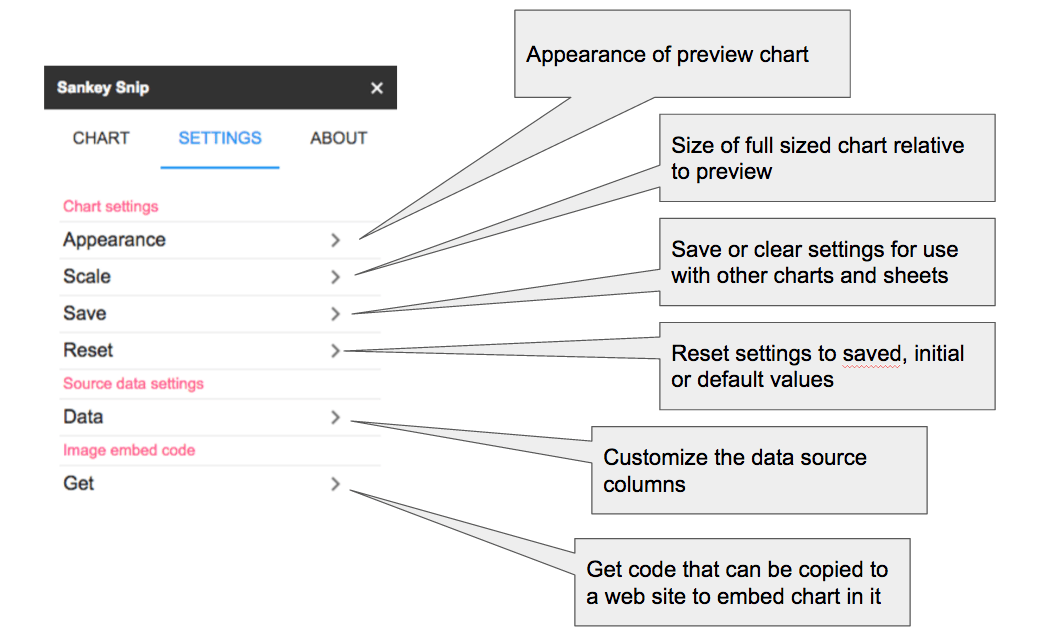
Chart settings
There are a large number of settings available to change the appearance of both the preview and full-sized chart. Let’s take a look through them. It should be evident from the images what each setting does.
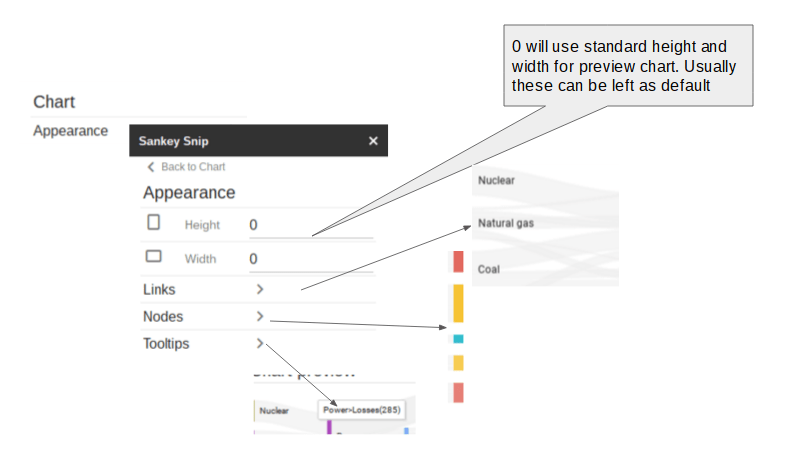
Preview Chart appearance
This dialog gives access to further settings to change the appearance of various attributes of the chart.
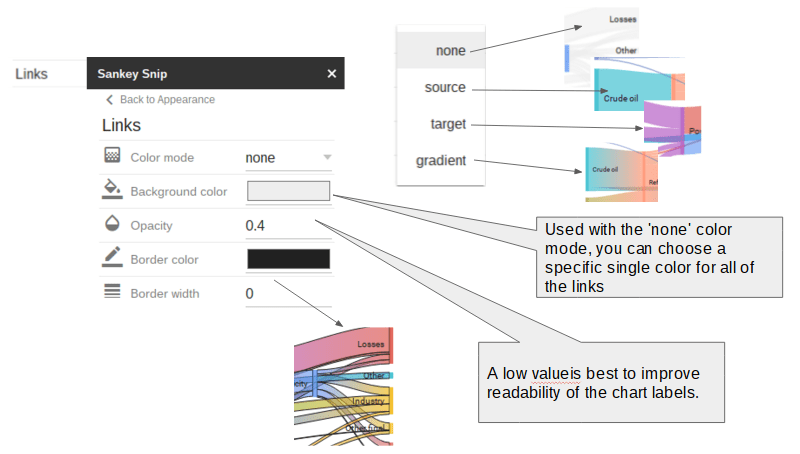
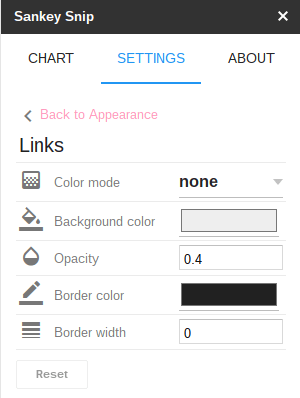
Link appearance
These settings set the appearance of the links between each node.
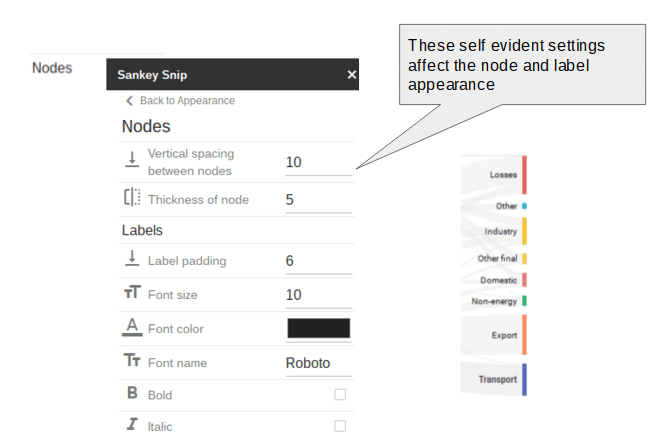
Node appearance
Each from and to item in the data results in a node. The links show the flow between the nodes, and the nodes are labelled up using the data from the sheet. The appearance and spacing of nodes and labels can be adjusted in the nodes dialog.
Tooltips
When you hover over the preview chart, tooltips show summary information about the source data for the link. These settings set the typography appearance. Tooltips are only available in the preview chart since an inserted chart is simply a scaled image.

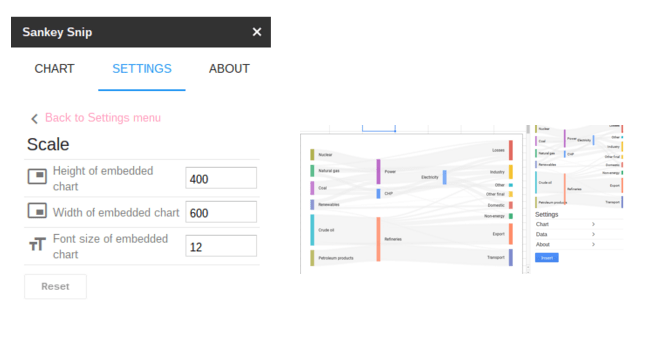
Scale
These settings are the sizes of the full-scale chart that you embed in your sheet with the Insert button.
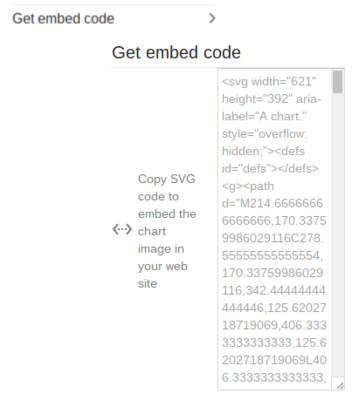
Embed code
Sankey snip creates SVG code that can be copied directly into a web page’s HTML code to embed the chart. Just copy the code in this dialog.
Managing settings
You’ll notice that each settings page has a reset button. This allows you to undo any changes you’ve made while on this settings page. It will be enabled if you have made any.
In addition, Sankey snip has a comprehensive way of making settings permanent so you can re-use them if you have a house or document style you want to follow, or for restoring complete settings as they were at the beginning of the session, or to the default values for the chart.
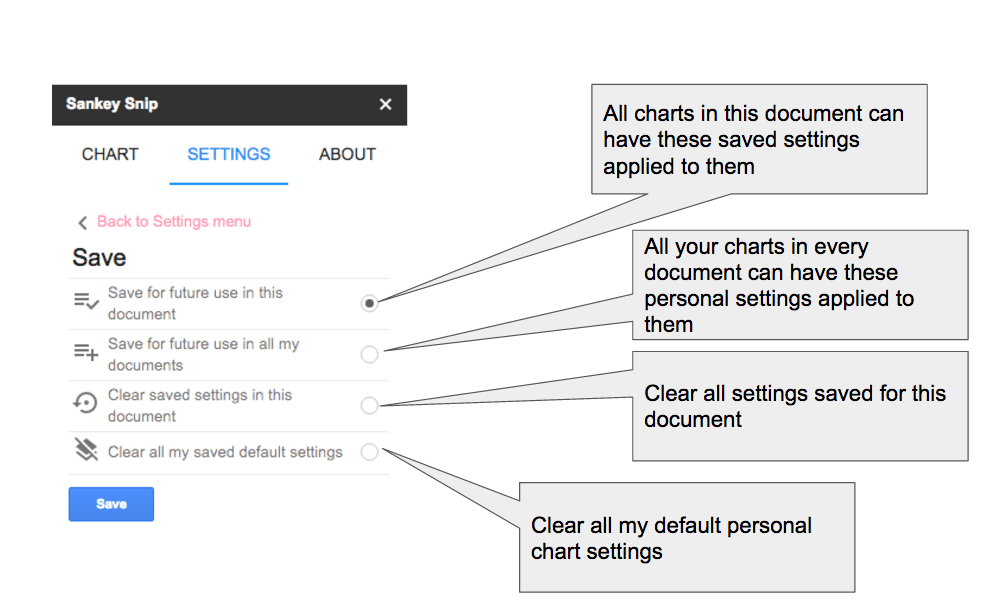
Save settings
This dialog allows you to retain the current settings so that they will apply each time you open this document, or to every document where you use Sankey Snip. Clear these settings will cause Sankey snip to revert to its normal default values in this and other documents.
Reset settings
Sankey snip follows this pattern when deciding which settings to use when opening, using the first settings collection that exists.

In an open document, you can select some different setting by using the Apply settings dialog

Respecting Filters
The add-on now uses SheetsMore to respect data, so the chart will pay attention to the most common types of filters selected in the UI. Since this is a service with a quota, the setting of respect filters is not saved to avoid unnecessary API traffic, so if you want it, you need to set it for your session. This behavior is set in the Data Settings.
Availability
This add-on is now available in the Sheets Add-on store.
Join our community for news of when this add-on is published so you can use it in your own workbooks.
Pro version
All features mentioned here are available in the current Sankey Snip version. At some future time, there might be a pro-version with additional capabilities, or a lite version with some features that might need to be unlocked before they are available. For more information on this join our community
Source code
As usual, the code is open source. You can find it on GitHub.
Other versions
If you are interested in creating Sankey Charts out of Excel, take a look at Sankey diagrams from Excel. An Office JavaScript API version of this will be available shortly. It is also opensourced. The code for this on github. Connect to our community on G+ to receive news about it.
- Chord Snip
- Color Arranger
- Debugging Office JavaScript API add-ins
- Dicers
- Dicers Pro and advanced features
- Measure round trip and execution time from add-ons
- Merging slide templates with tabular data
- Office Add-ins – first attempt
- Orchestrating competing google and Office framework loads
- Plotting maps with overlays Sheets add-on starter
- Promise implementation for Apps Script Stripe payments
- Repeatable add-on settings layouts and style
- Sheets API – Developer Metadata
- SlidesMerge add-on
- Unpicking the Google Picker
- Watching for changes in an Office add-in
- When test add-ons doesn’t work
- Polyfill for Apps Script properties service for the Office JavaScript API