In plotting functions in Excel I showed how to create plots from equations without needing to create a data table. Using the same template, here is the Excel version of the well known Batman Plot.

Using these parameters
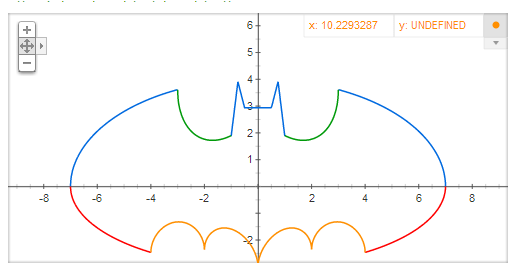
x from -7
x to 7
no of points 1000
Title batman
ySeries 1= 2*SQRT(-ABS(ABS(x)-1)*ABS(3-ABS(x))/((ABS(x)-1)*(3-ABS(x))))*(1+ABS(ABS(x)-3)/(ABS(x)-3))*SQRT(1-(x/7)^2)+(5+0.97*(ABS(x-0.5)+ABS(x+0.5))-3*(ABS(x-0.75)+ABS(x+0.75)))*(1+ABS(1-ABS(x))/(1-ABS(x)))
ySeries 2= (-3)*SQRT(1-(x/7)^2)*SQRT(ABS(ABS(x)-4)/(ABS(x)-4))
ySeries 3= abs(x/2)-0.0913722*(x^2)-3+sqrt(1-(abs(abs(x)-2)-1)^2)
ySeries 4= (2.71052+(1.5-.5*abs(x))-1.35526*sqrt(4-(abs(x)-1)^2))*sqrt(abs(abs(x)-1)/(abs(x)-1))+0.9
The Google version is better, since it somehow does not plot the interior lines, but that’s enough for today.
Acknowledgement to this informit article by Rob Bovey, Stephen Bullen, and John Green for the pointers on how to do this.
You can download this from the batman worksheet of the funnycharts.xlsm workbook. You can find more information on the Excel Liberation site.
Finally got round to writing up equations plots in Excel. https://ramblings.mcpher.com/Home/excelquirks/funnycharts