D3
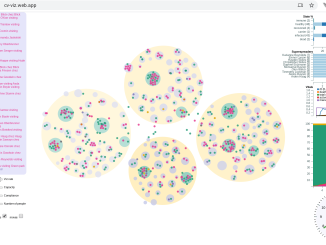
Coronavirus-d3.js viz: Detecting and dealing with collisions in force simulations
These snippets look at dealing with collisions in a force-directed simulation […]
These snippets look at dealing with collisions in a force-directed simulation […]
The coronavirus is with us, and naturally, there’s much interest in data on its mortality, reach and spread, and of course much discussion on lockdowns, health capacity, social distancing and how they might affect those […]

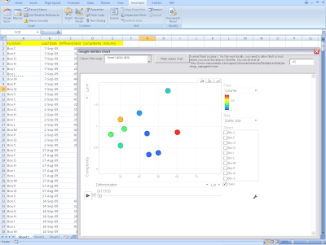
The source data colorTable we want to load to our parse.com database is currently in a Google Spreadsheet. With scriptDB, we can access it directly. However, to load data into parse we need to use the google visualization query […]
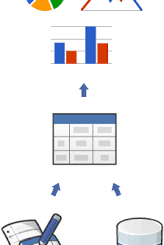
javaScript: creating google visualization charts and tables This relates to Data Driven Mapping applications and the Javascript HowTo section Google Visualization tables and charts All visualizations are created from the dataViews mentioned in Using Google Visualization DataViews. Once […]

This is part of the Step by Step Guides to get started with some of the more complex topics on this site. The full story on vizMap applications can be found at Data Driven Mapping applications […]
This is part of the Step by Step Guides to get started with some of the more complex topics on this site. The full story on vizMap applications can be found at Data Driven Mapping applications […]
This is part of the Step by Step Guides to get started with some of the more complex topics on this site. The full story on vizMap applications can be found at Data Driven Mapping applications […]
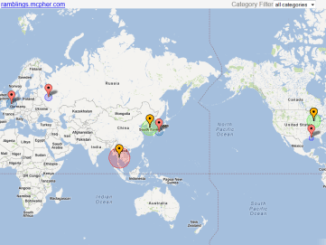
How to put markers on maps This is part of the Step by Step Guides to get started with some of the more complex topics on this site. The full story on vizMap can be found […]
How to put markers on maps This is part of the Step by Step Guides to get started with some of the more complex topics on this site. The full story on vizMap can be found […]
How to modify geocoding and mapping parameters This is part of the Step by Step Guides to get started with some of the more complex topics on this site. The full story on marker parameters can be […]
This is part of the Step by Step Guides to get started with some of the more complex topics on this site. The full story on flightPaths can be found at Adding flight paths to Maps […]
This is part of the Step by Step Guides to get started with some of the more complex topics on this site. The full story on marker quicklinks can be found at Overlaying circles and heatmaps What you […]
This is part of the Step by Step Guides to get started with some of the more complex topics on this site. The full story on marker quicklinks can be found at Overlaying circles and heatmaps What you […]
This is part of the Step by Step Guides to get started with some of the more complex topics on this site. The full story on marker quicklinks can be found at Quicklinks and Categories What you […]
This is part of the Step by Step Guides to get started with some of the more complex topics on this site. The full story on map quicklinks can be found at Quicklinks and Categories What you need […]
How to put markers on maps This is part of the Step by Step Guides to get started with some of the more complex topics on this site. The full story on map markers can be found […]
This is part of the Step by Step Guides to get started with some of the more complex topics on this site. The full story on geocoding can be found in Complete Excel Address Data with […]
One the things I wanted to play around with was visualizing this site content with d3. But first I needed to create something which would generate data from the site (any domain site actually). It’s easy […]
The Charts Service Google Apps Script offers a charts service. Using this you can build a dataTable as input to a chart, as well as the chart itself. Elsewhere on this site I covered how to […]
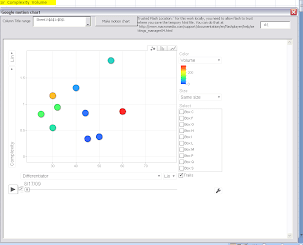
What are google visualization charts Google provides a growing number of cool charts that are not available in Excel. For this article we are going to focus on the the Google Motion Visualizations. Please take […]
In a previous section , I explained how to create javascript to create a Google Motion Chart directly from your from Excel data, and optionally embed it in your workbook. Since it is of course […]
We previously looked at how to embed a motion chart in excel, as well as how to serialize data as input to one. As a matter of fact, the interaction with the visualization API and […]
If you try to access data in a different domain from a client-side app, you’ll often get an error about CORS (cross-origin resource sharing). I’ve dealt with this topic before in Cross Origin Resource sharing (CORS), […]
I’ve been playing around with the live integration of large cloud based data sets with D3.js. Most visualizations with D3 use some kind of static data, but I became interested in pulling different source into d3. […]
How to create d3.js force diagrams from excel tables In Sankey diagrams from Excel and Creating d3.js Tree diagrams the input data for these d3.js visualizations was of a specific layout. We are now going to look at a more generalized […]
Since the 50’s, there has been an annual song contest involving many European countries. It’s a fairly bizarre event, but one of the most interesting things about it is the voting system. Countries vote for […]
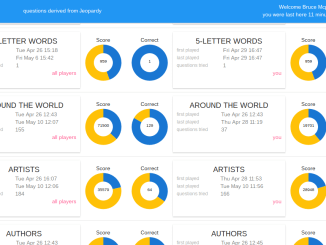
‘m showing score reports for the BigQuiz app. This is an individual players score compared to the maximum he could have got as well as the number of questions that were correctly answered, and also comparing […]
In this section, we’ll build an application that pulls together many concepts already covered elsewhere on this site. You can run it standalone at xliberation.com, or below, embedded in this page The target application Pulling together Playing […]
This is an interesting d3.js and parse.com mashup of a number of topics covered on this site. The target is to build an app that Retrieves color scheme data from a parse.com database, much like […]
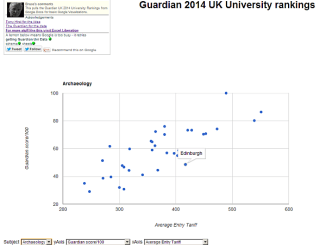
Using the Guardian UK university 2014 rankings to demonstrate, here’s how to mashup a few bits and pieces to visualize them. This is pretty generalized, so can be applied to any data set with fairly minimal changes. […]
Create Google visualizations straight out of Excel. Here you can download a prebuilt application, googleCharts.xlsm that demonstrates how to integrate google Visualizations with Excel. The subsequent pages are about how to develop such an application […]
Chord snip is an add-on for Google Sheets that creates a Chord diagram as you type, gives you the SVG code to embed it in a web site and the ability to embed it in […]
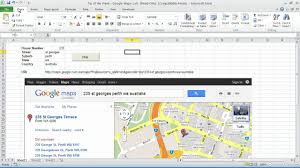
Geocoding, Mapping and creating data driven applications straight out of Excel get it now This article will cover 3 main topics. I wrote all this stuff a few years ago, and some of the services may […]

What can you learn here? scriptcontrol object call from VBA use javaScript The ScriptControl Object This object gives you access to a scripting engine that will accept scripting in both javaScript and VBScript. Since this site has […]
bruce mcpherson is licensed under a Creative Commons Attribution-ShareAlike 4.0 International License. Based on a work at http://www.mcpher.com. Permissions beyond the scope of this license may be available at code use guidelines